|
|
 |
| |
Home > Chapter 1
|
|
Chap I. Environment and Economic development
|
About 57 per cent of Rwandans, a majority of them women, live in abject poverty, surviving on less than US $1 per day. In most instances, this category is prone to conditions where many children do not receive even a basic education. Additionally, many households do not have access to basic sanitation or water supplies. In recognition of the strong linkages between poverty and environment, one of the Millennium Development Goals (MDG 7) seeks to integrate the principles of sustainable development into country policies and programmes, and reverse the loss of environmental resources (ROR 2007). Box 1 highlights MDG 7 and its targets.
The livelihoods and food security of the poor often depend directly on ecosystems, and the diversity of goods and services derived from these ecosystems. Healthy ecosystems provide a range of invisible services that are essential for sustainable development. Achievement of national and international sustainable development goals and effective support to poverty reduction initiatives will require Rwanda to integrate environment and natural resources management principles into the national planning process for economic development.
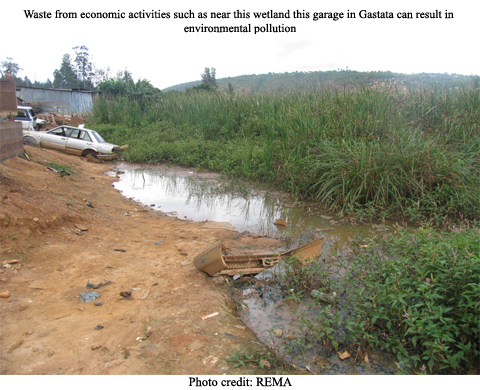
The economy is also linked to the environment in many important ways. All economic activities including production, consumption and waste disposal subsist in the environment. It has become abundantly clear that the state of environment determines the level of prosperity not only in the short term but also for future generations. This underlines the need to examine both economic and environmental indicators to determine the impact on the environment of a range of economic activities in Rwanda and conversely, how wise use of environmental resources can increase economic growth.
|
Box 1: Millennium Development Goal 7
Goal: Ensure environmental sustainability
Targets:
- Integrate the principles of sustainable development into country policies and programmes; reverse loss of environmental resources
- Reduce by half the proportion of people without sustainable access to safe drinking water
- Achieve significant improvement in the lives of at least 100 million slum dwellers by 2020.
SOURCE: UNEP 2006.
|
The State of the Economy Based on Macro-Economic Indicators
|
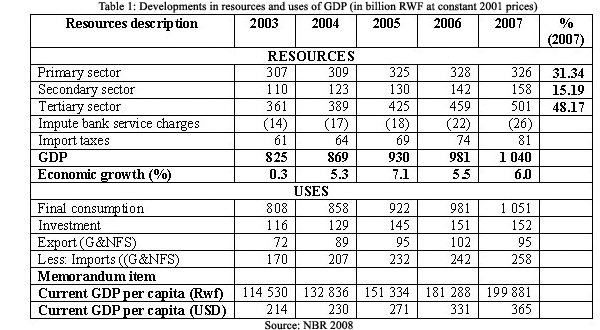
In Rwanda the real GDP at constant prices of 2001 grew by 6 per cent in 2007 against 5.5 per cent in 2006. GDP growth during the last 5 years has reflected a positive trend even if there was a decrease of 1.6 per cent between 2005 and 2006. This growth emanated from the recovery of the tertiary and secondary sectors which recorded an increase of 11.4 and 9.2 per cent respectively of the value added in 2007 compared to the previous year (NBR 2008).
The primary sector is not the major contributor to economic growth because high population densities on rural land coupled with poor farming methods have resulted into alarming soil losses with adverse effects on agricultural production and productivity. The value added for 2007 in constant prices of 2001 for the primary sector declined by 0.5 per cent. The tertiary sector maintained the first position in the structure of GDP with 48 per cent of the GDP at constant prices of 2001, followed by primary sector (31 per cent) and then secondary sector with 15 per cent of the GDP in 2007 (NBR 2008).
This current structure of GDP for which the tertiary sector is a major contributor to the economy is a good indicator that the pressure on natural resources may be remarkably reduced to allow environment conservation. However, this aspect has not considered population pressure which is a second driver.
GDP per capita at current prices improved by 6.6 per cent: rising from 181.3 to 199.9 thousand Rwanda Francs. In terms of US $ there was an increase of 10.3 per cent: from US $ 331 to 365 in 2006 and 2007 respectively. This is shown in table 1.
|
Inflation
|
Modern economists generally tend to agree that inflation does not favour rapid economic growth and the benefits of lowering inflation are great if the policy makers are willing to support sustainable economic growth.
During the period from 2003 to 2007 the consumer price index continued to rise on monthly and annual average. In 2007 annual overall inflation reached 9.1 per cent against 8.9 per cent in 2006 (NBR 2008).
In terms of import indices, the volume and the value indices increased by 43.84 and 47.04 per cent, in 2006 and 2007 respectively. Among imported goods, energy and lubricants registered the greatest rise of 99.46 per cent in value. Fuel led with a rise of 106.32 per cent in value against a rise of 5.33 per cent in volume (NBR 2008).
Generally, inflation in Rwanda emanated from local products and services. The cause of this was bad weather conditions which affected the production of foodstuffs. This fact goes to show how environmental services which are linked to climate variability can significantly impact the national economy. With imported goods, inflation depends on prices on the international market and Rwanda has no control over those. Those prices affect particularly the supply of petroleum, cereals and bread. It is clearly evident that economic factors at the household as well as macroeconomic levels are very much linked to environmental goods and services and there is thus every justification for environmental factors to form key considerations in economic planning for effective poverty reduction and enhanced economic growth.
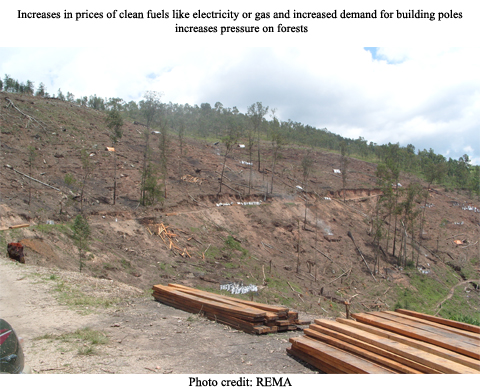
Products and services affected by inflation may exert pressure on the environment by reducing the real value of financial resources earmarked for environmental rehabilitation as well as user and pollution charges and by accentuating pressure on the environment by an increase in investment in agriculture for food production. Also, the increase in prices of housing, water, electricity, gas and other fuels can lead to a situation where achieving MDG 7 will not be easy for those with low income.
|
External debt
|
Rwanda, like most developing countries, has experienced debt distress over the last two decades arising from increased external borrowing (to finance mainly high energy costs like crude oil), fiscal deficits, and development programs, among others. Table 2 shows Rwandas public external debt.
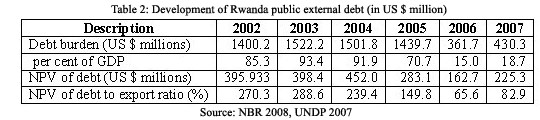
In May 2005, Rwanda became the 18th country to benefit under the Heavily Indebted Poor Country Initiative. This debt relief, offered under the Heavily Indebted Poor Country framework, has played a role in increasing the domestic fiscal space available to Rwanda, since the debt burden fell from 93.4 to 15 per cent of GDP. In addition to the Paris Club country loans in 2005, the implementation of the G8 countries decision to cancel the total debt due to the International Monetary Fund (IMF) and an important part of debt stock due to International Development Association (IDA) and the African Development Bank (AfDB) Group by the heavily indebted poor countries did reduce Rwandas public external debt stock from US $1523.4 million in 2005 to US $449.8 million in 2006 and US $503.2 million in 2007 (NBR 2008).
Foreign aid and investments are still important due to the balance between the local revenue and the needs for investments. In 2007, tax revenue was 242 billion RWF from the countrys revenue collections which included income tax, (corporate profit tax, sole trader profit, tax on loans and pay as you earn), value added tax, customs duty and excise duty. International donors provided the rest of the budget equivalent to 251 billion RWF (51 per cent with 86 per cent of the foreign aid in form of donor grants). In 2007, the public external debt of Rwanda was mostly loans from multilateral institutions, such as World Bank, AfDB and the IMF and represented 85.51 per cent of total public external debt. The remaining 14.49 per cent was from bilateral partners (NBR 2008).
The analysis on inflation demonstrated that Rwanda may not be able to achieve the MDGs if inflation on key sectors of housing, water and energy continues to rise. Even so with debt service, these same sectors will continue to dominate the external loans that will impact on the overexploitation of the resources needed for them.
In order to reduce the dependency on foreign aid, efforts are underway to diversify exports but products are still based on natural resources. Some of the new products include handicrafts (agaseke) specifically for women; and new crops such as passion fruit, pineapple and flowers. Rwanda will, in parallel, continue to diversify sources of revenue collection into areas such as urban construction and real estate. Other solutions are to increase the electricity generation capacity to facilitate more investments in the industry sector when financial resources permit.
|
Budget allocation
|
Government budget allocated to sectors with a bearing on the environment has been very limited in the past few years and focused on supporting other sectors such as agriculture (including marshland reclamation), energy (addressing the energy crisis and introduction of alternative sources of energy) and access to water. This was mainly linked to the fact that during the implementation of the Poverty Reduction Strategy Paper (PRSP 1 between 2003 and 2005) environment was not considered as sector but only a cross cutting issue. It is therefore not easy to evaluate the resources allocated to environment before the year 2003 when the ministry in charge of environment (MINITERE) was created.
From 2003 to 2007, the budget allocated to environment grew from 0.06 per cent to 1.15 per cent. This situation will remain the same during the current Economic Development and Poverty Reduction Strategy (EDPRS) period as mentioned in the budget framework paper 2008 (MINECOFIN 2007). The share of environment, land and forestry will not exceed 1.8 per cent of the total expenditure and not 4.9 per cent in the Capital Development and Productive Sectors expenditure - the first priority type of expenditure in the EDPRS (ROR 2007).
In 2005, the overall aid directed to environmental protection constituted only 1 per cent of the total overseas development assistance (ODA) disbursed in that year. However, due to its cross-cutting nature, some funds from health (12 per cent), energy (2 per cent), agriculture (4 per cent) and water and sanitation (3 per cent) may have contributed to environment management depending on how well mainstreamed environment was in those sectors. Figure 1 highlights this issue.
It is worth noting that there has been no actual public expenditure review to track spending on environment to date and therefore the information on cross-sectoral spending on environmental priorities is not available. In the course of implementing the EDPRS, REMA plans to conduct a comprehensive public expenditure review as well as environmental fiscal reform as a means to finance environment.

|
Economic growth and the Environment
|
Rwandas economy and the livelihoods of her people are dependent on natural resources such as water, land, air, plants and animals. These natural resources are increasingly under pressure from unsustainable use resulting in environmental degradation. The challenge is to utilize natural resources to develop the economy while at the same time conserving the environment to avoid the adverse impacts of pollution, soil erosion, deforestation and general degradation.
Over the past years, Rwandas economic growth, as shown by trends in real GDP, has been on the increase, mainly due to good performance of the tertiary and secondary sectors. This could be taken as an indicator that economic growth is not putting much pressure on natural resources. However the same growth, if not controlled may lead to an increase of pollution loading which may affect the environment.
The EDPRS of 2007 assigns the highest priority to accelerating economic growth to create employment and generate exports. With two thirds of the population aged less than twenty-five years, particular emphasis is placed on creating jobs for young people. The annual GDP growth rate is planned to rise from 6.5 to 8.1 per cent by 2012. Exports growth is scheduled to increase at 15 per cent per annum compared to the current rate of 10 per cent. This accelerated pace of growth will be made possible through a large increase in the investment rate which will rise from 15 to 23 per cent of GDP by 2012 (ROR 2007).
|
Importance of the natural resources in the economy
|
The productive sector requires basic inputs such as labour, capital, land and entrepreneurs. In the case of Rwanda, both land and capital can be defined broadly to include natural resources used in the productive process including organic matter, soil, water, forests, fisheries and energy. Industrial processes, too, depend on natural resources for instance minerals, petroleum products, animals and plants which are used as raw materials or inputs for production. Box 2 explains the three-sector hypothesis which is used to describe Rwandas economy in the sections that follow.
|
Box 2: The three-sector hypothesis
The three-sector hypothesis developed by Colin Clark and Jean Fourastié is an economic theory which divides economies into three sectors of activity:
- The primary sector of the economy involves changing natural resources into primary products. Most products from this sector are considered raw materials for other industries. Major businesses in this sector include agriculture, agribusiness, fishing, forestry and all mining and quarrying industries.
- The secondary sector of the economy includes those economic sectors that create a finished, usable product: manufacturing and construction. This sector generally takes the output of the primary sector and manufactures finished goods or where they are suitable for use by other businesses, for export, or sale to domestic consumers.
- The tertiary sector of economy (or service sector) is involves the provision of services to businesses as well as final consumers. Services may involve the transport, distribution and sale of goods, or may involve the provision of a service, such as pest control or entertainment.
Source: Wikipaedia 2009.
|
The primary sector
A sector by sector analysis shows that the primary sector has realized poor performance in comparison with other sectors due to unfavorable climatic conditions and poor traditional farming methods. With agriculture being the main source of livelihood and employment particularly among the rural population, the poor performance of the primary sector has a serious impact on the economy.
An analysis of the value added for the primary sector shows that there is no one trend direction. Between 2003 and 2004, there was a stagnation followed by an increase in 2005. More recently, in 2007, the value added for the primary sector declined by 0.5 per cent, with a decrease of 1.96 per cent for agriculture and an increase of 38.9 per cent for mining.
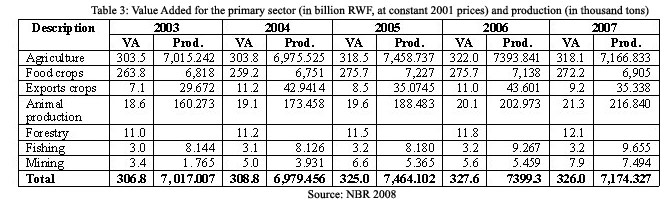
In 2007, production of food crops experienced a decline of 3.3 per cent compared to the two previous years mainly due to delayed rain season in some parts of the country. The same trend was experienced for export crops which decrease by 16.4 per cent also attributable to bad climatic conditions but also to the lack of maintenance of coffee factories. The forestry sector slightly increased for the 5 years period, the situation which indicates low level of forest exploitation resulted from recent measures taken to protect environment by limiting forests exploitation. This is shown in table 3.
Mining and quarrying activities registered positive developments over the last five years. There was exceptional performance between 2006 and 2007 where an increase of 40 per cent of the value added and 37.3 per cent of the volume of the main minerals production (tin, colombo-tantalite and wolfram was observed. To this effect, the price of wolfram at the international market encourages the extraction of this mineral and its volume attained an increase of 87 per cent rising from 1 436 tons in 2006 to reach at 2 686 tons in 2007. The production of all other minerals has increased compared to 2006, such as 28.7 per cent for colombo-tantalite and 19.1 per cent for tin.
Secondary sector
The secondary sector is made up mainly of manufacturing industries: construction, public works, electricity, gas and water. Only manufacturing industries and construction including public works realized a good performance during the previous five years with an outstanding performance during 2006-2007. Value added (at constant 2001 prices) experienced a growth of 11.4 per cent in 2007 compared to that of 2006, as a result of outstanding performance in manufacturing industries and construction and public works which recorded 7.9 per cent and 15.9 per cent respectively in 2007 (NBR 2008).
As indicated earlier, the industry sector depends mainly on natural resources due to the use of local raw materials for the manufacturing, construction and public works sub-sectors. Most agro-processing industries use natural resources to transform crops or output of primary sector production; for instance, grain milling, fruits, legumes, bakeries, milk, alcoholic and non-alcoholic beverages, sugar production, wood, paper, tobacco, cement, full washed coffee and tea factories. In addition most of those industries use fuel wood as the main source of energy especially tea factories some of which even have their own forest plantations. The construction sub sector also uses local material such as quarries, clays, and wood.
In terms of production the top 5 industries associated with significant pressure on the environment include: cement, modern beer, soft drinks, sugar and bakeries. The importance of natural resources is further demonstrated by the value added generated by local enterprises that is having a positive impact on the rural economy. An example is Urwibutso enterprise in the Rulindo district that makes Agashya juice (passion juice): value addition in 2007 was 59 per cent equivalent to 1,314,704,891 RWF.
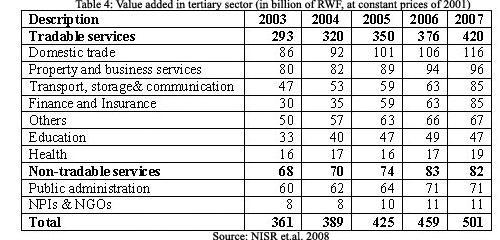
Tertiary sector
Value added by tradable services in 2007 rose by 11.4 per cent at constant prices of 2001. The two sectors of transport and communication; and finance and insurance also continued their value added growth of 34.6 and 20.4 per cent respectively. Commercial services had registered a growth of 8.9 per cent of its value added. Table 4 shows value added in the tertiary sector from 2003 to 2007.
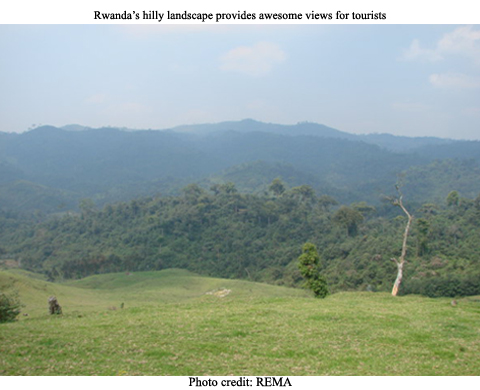
Rwanda has a substantial advantage in the tourism sector that offers many investment opportunities. In fact the sector has grown steadily to become the second source of exports (behind coffee but ahead of tea and mining). The government has developed a strategy for the development of tourism that focuses on high-end eco-tourism and invites investment into the sector. It includes improving planning for wildlife and national park conservation; promotion of research and monitoring of wildlife, including restocking national parks with relevant wildlife; involvement and engagement of local communities, and also provides for the channelling of tourism revenues towards the protection of the natural resource base. If well implemented, this strategy will allow the development of tourism that is ecologically friendly and environmentally sustainable.
To achieve sustainable economic growth and social development, therefore, the government is implementing the Economic Development and Poverty Reduction Strategy. It has a three pronged approach: sustainable growth for jobs and exports; Vision 2020 that aims to reduce poverty through a pro-poor national growth agenda; and a third tier that aims to improve Rwandas international standing and reputation through improved governance. Environment and natural resources use form the foundation for all other sectoral activities and is thus envisaged to be a fundamental component of sustainable national development for the EDPRS (ROR 2000).
|
Poverty and Environment
|
Where are the poor?
The EDPRS puts the upper poverty line at 56.9 per cent and those living in extreme poverty at 36.9 per cent (ROR 2007). Rural areas are relatively poorer than urban areas. Poverty in rural areas is 62.5 per cent compared to 13 per cent for Kigali City and 41.5 per cent for other towns. Extreme poverty in rural areas is 40.9 per cent of the population (ROR 2007). Poverty also strikes hard in rural areas where 45 per cent cannot meet their food needs (ROR 2006). In terms of inequality, the Gini coefficient compared to the situation of 2000 has shown an increase from 0.47 to 0.51. This indicates that there is still inequity in access to national revenue including access to natural resources, especially to the land (ROR 2007).
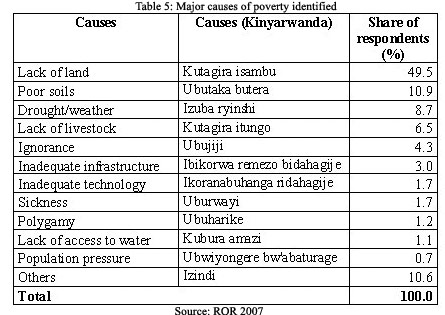
Causes of poverty
The five major causes of poverty as identified in Ubudehe survey conducted in 2005, are the lack of land, soil infertility, weather conditions, lack of livestock (often linked to soil infertility) and ignorance (ROR 2007). The first four causes are directly linked to the environment. The same survey identified also sickness, polygamy and lack of access to water among other causes of poverty. Table 5 highlights some of the causes of poverty.
Exit strategies out of poverty were identified as paid employment, commerce and livestock. Unfortunately the primary sector continues to dominate as a source of employment in Rwanda. This, therefore, does not facilitate the acceleration of poverty reduction with the desired speed. According to Integrated Household Living Conditions Survey (EICV2), the major employer for the population over 15 years is the primary sector which employs 83.3 per cent of active population in urban and rural areas. Its followed by the tertiary and secondary sectors employing 12.12 and 2.9 per cent of the active population in rural and urban areas (NISR et.al. 2008).
Poverty, soil erosion and food security
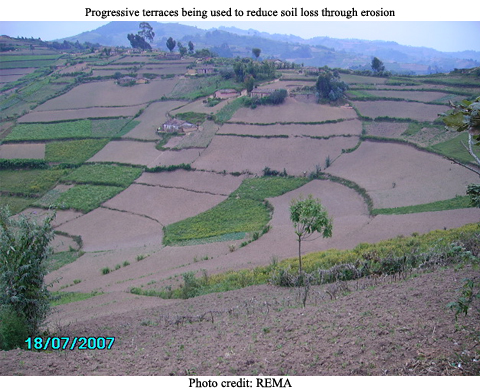
Rwanda is among three countries in Africa, experiencing unusual heavy soil losses. About half of Rwandas farm land has shown evidence of modest to severe erosion. Besides being acidic, most of the soils are exhausted from continuous faming by farmers who have limited, if any alternatives. Several studies have shown the immediate effect of erosion on land productivity. A loss of an inch of top soil results into considerable reduction of productivity for the farmers. Extensive soil erosion also has the potential to convert land to waste land. In 1986, the agricultural survey and statistic service estimated that 10 tonnes/ha of arable land is carried away by erosion every year. The deterioration of soil reduces food availability for people who depend solely on agriculture. Indeed it is estimated at about 40,000 people each year fail to be fed due to soil erosion (ROR 2004)
The Integrated Household Living Conditions Survey (EICV2) further shows that 45 per cent of children under-five are stunted, 23 per cent are underweight and only 44 per cent of the population has sufficient access to proteins per day (NISR et.al. 2008).
Figure 2 shows food insecurity by different regions in Rwanda and indicates a high correlation between food insecurity, population density and poverty. Some of these include the region of Congo-Nile ridge where soil erosion and degradation is prevalent; the region of Bugesera which has experienced long periods of drought and low levels of rainfall; and the southern plateau and where land is scarce with extremely high population density.
Poverty is also associated with environmental degradation. Equally, with reduced environmental products, poverty will deepen increasing the pressure on environment even more. Thus a vicious cycle characterizes the relationship between poverty and the environment, with the poor as both victims and agents of environmental degradation. The prevalence of rural poverty has important implications for agriculture and environment in that it is unlikely that the rural population can afford agricultural intensification of their holdings and this further limits production.

|
Conclusion
|
Rwandas economy and the livelihoods of her people are dependent on the natural resources. However, the natural resources, especially land, are increasingly under pressure from population pressure and unsustainable use. This leads to environmental degradation and may jeopardize economic growth and efforts for poverty alleviation if nothing is done.
Efforts towards sustainable economic growth are underway and include government policy is to increase crop and livestock production and raise productivity through land consolidation, crop processing industries, introduction of new high value crops under the green revolution programme and modernization of livestock to improve productivity and reduce pressure on environment.
With regards to pollution control and management, the introduction of environmental impact assessment and environmental audits by the organic law on environment, and introduction of cleaner production program in industries are tools towards a sustainable economic growth.
|
References
|
- MINECOFIN (2007). Budget Framework Paper 2008 2010. September 2007. Ministry of Finance and Economic Planning (MINECOFIN), Kigali.
- NBR (2008). Annual Report 2007. National Bank of Rwanda (NBR), Kigali.
- NISR and WFP (2006). Comprehensive Food Security and Vulnerability Assessment. Strengthening Emergency Needs Assessment Capacity (SENAC) Project. National Institute of Statistics of Rwanda (NISR) and World Food Programme of the United Nations (WFP), Kigali.
- NISR, MOH and Macro International (2008). Enquête Intémediaire Démographique Et De Santé 2007-2008. Rapport Préliminaire Institut National Institute of Statistics of Rwanda (INSR), Ministry of Finance and Economic Planning, Ministry of Health (MOH), Macro International, Calverton, Maryland, USA.
- RDP (2008). Development Cooperation and Aid Coordination in Rwanda from 1990 to 2005. Rwanda Development Partners (RDP), Kigali. Also available on: http://www.devpartners.gov.rw/docs/index.php?dir=Studies+and+Reports%2F
- ROR (2000) Vision 2020. Ministry of Finance and Economic Planning, Republic of Rwanda (ROR), Kigali
- ROR (2004). Strategic Plan for the Transformation of Agriculture in Rwanda (PSTA I). Ministry of Agriculture and Animal Resources, Republic of Rwanda (ROR), Kigali.
- ROR (2006). National Youth Policy. Ministry of Youth, Culture and Sports, Republic of Rwanda (ROR), Kigali.
- ROR (2007). Economic Development and Poverty Reduction Strategy, 2008-2012. Ministry of Finance and Economic Planning, Republic of Rwanda (ROR), Kigali.
- UNDP (2007). Turning Vision 2020 into Reality: From Recovery to Sustainable Human Development.
National Human Development Report, Rwanda 2007. United Nations Development Programme (UNDP), Kigali.
- UNEP (2006). Africa Environment Outlook. Our wealth, Our health. United Nations Environment Programme (UNEP), Nairobi.
- Wikipaedia 2009. Three-sector hypothesis. Wikipaedia, The Free Encyclopaedia. Also available on: http://en.wikipedia.org/wiki/Three-sector_hypothesis
|
|
|
|